Contents
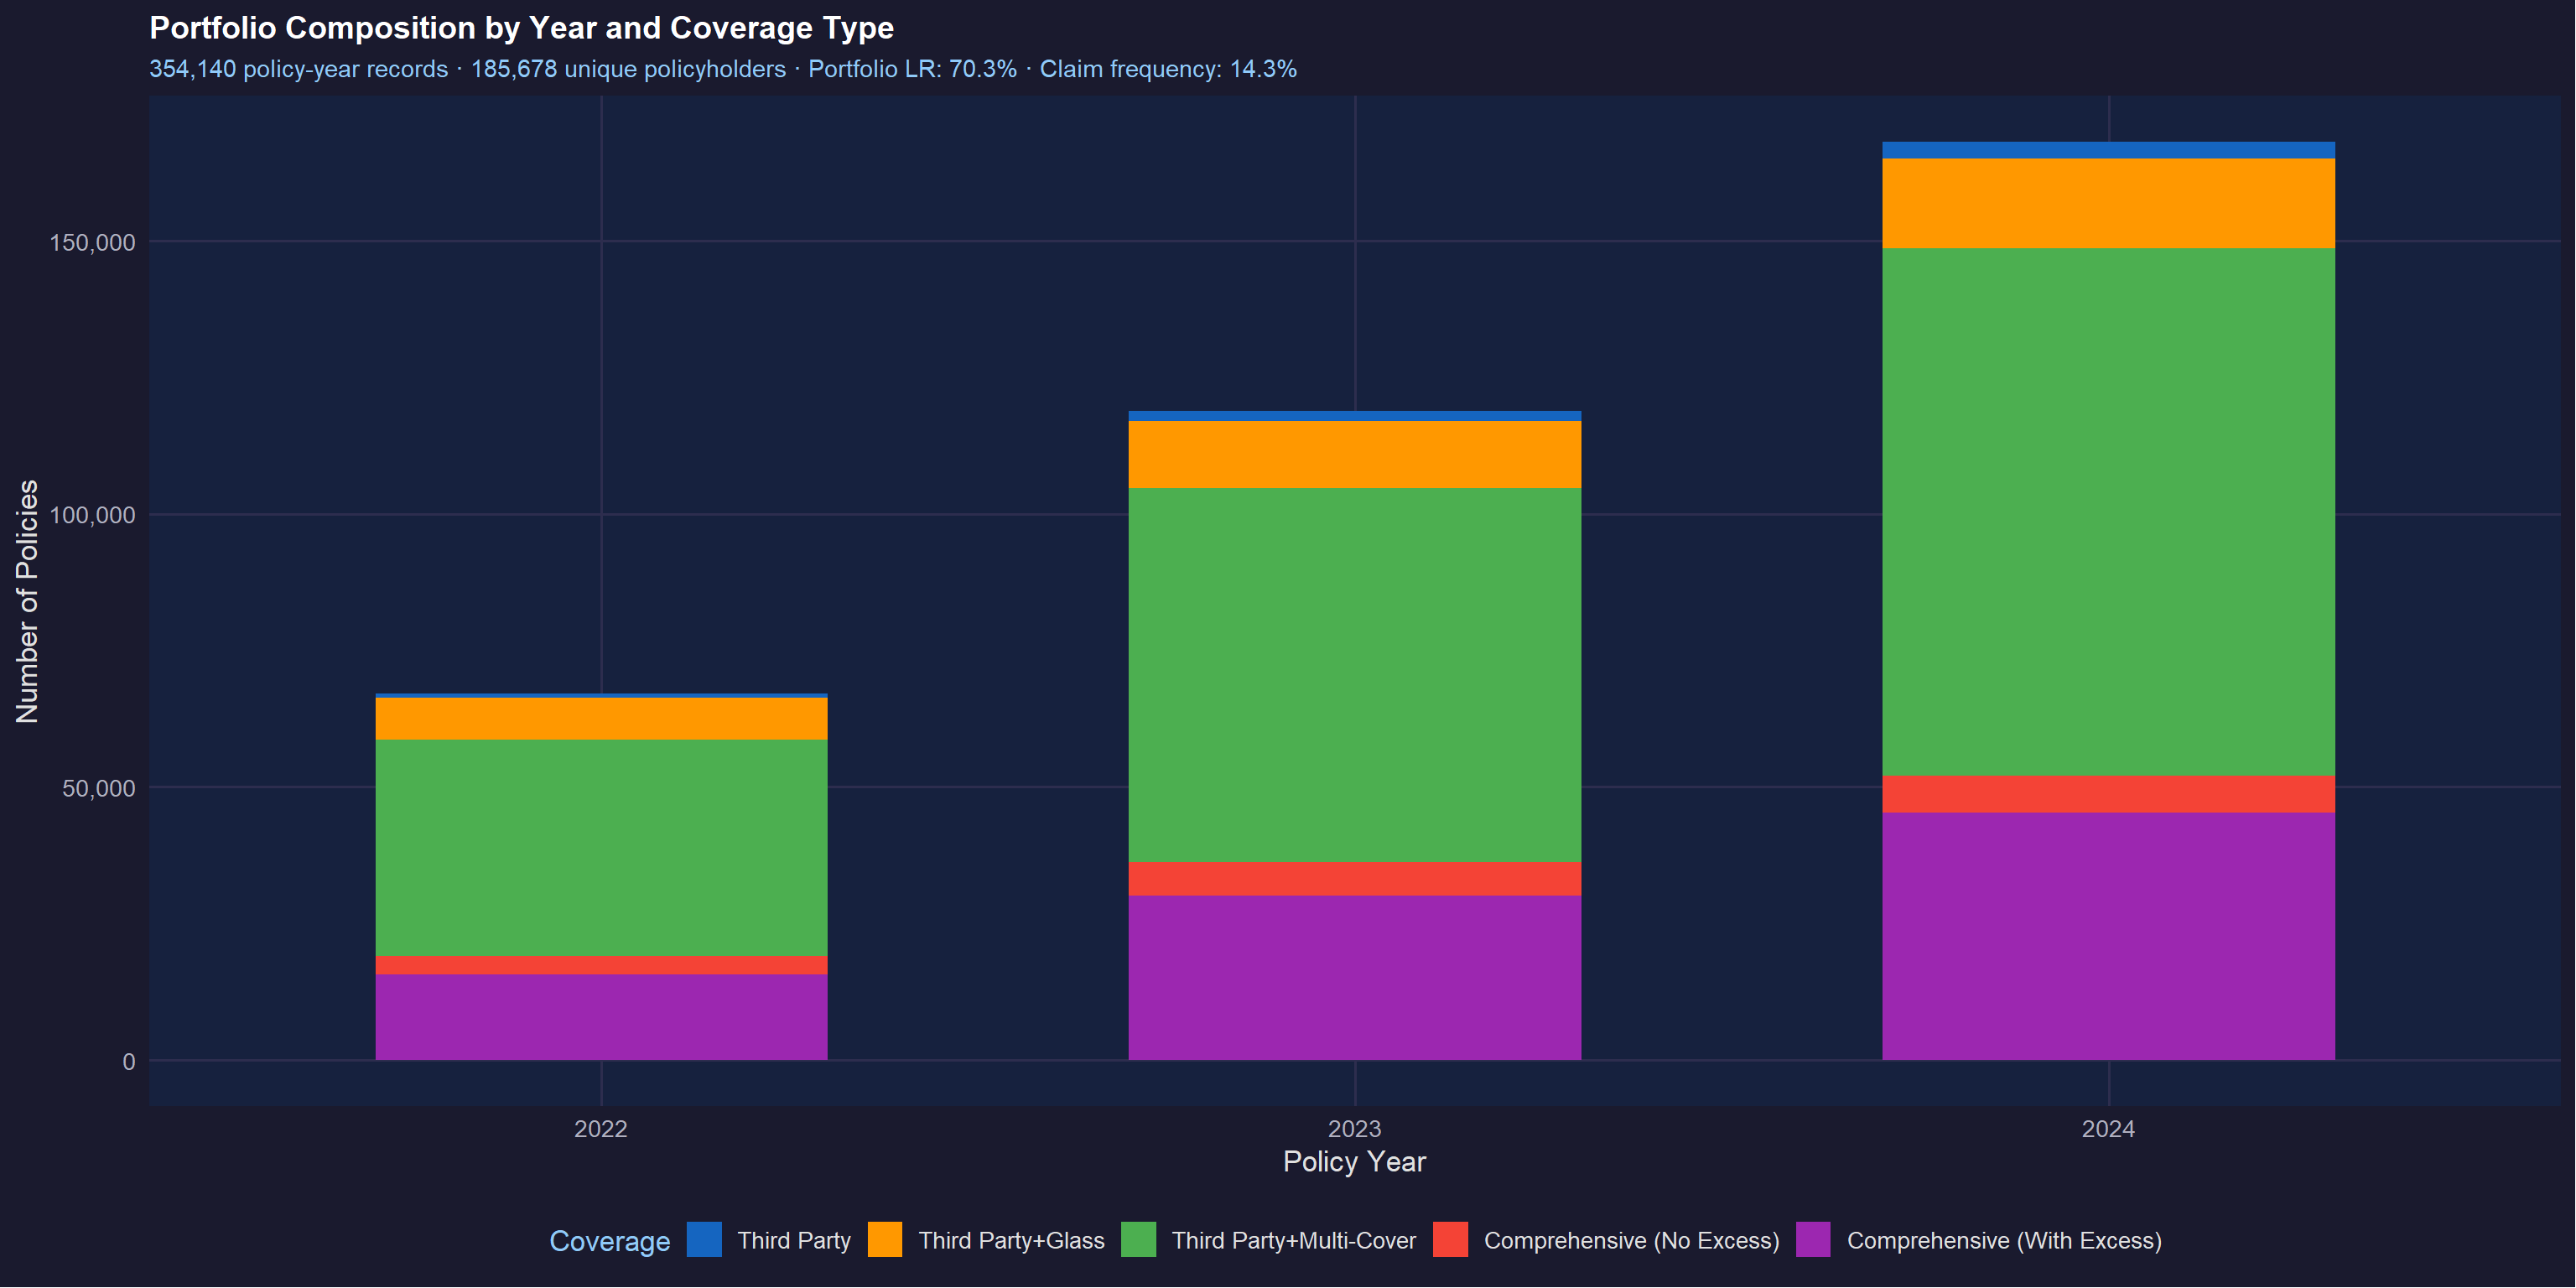
- Dataset Overview — Portfolio scope, structure and key KPIs
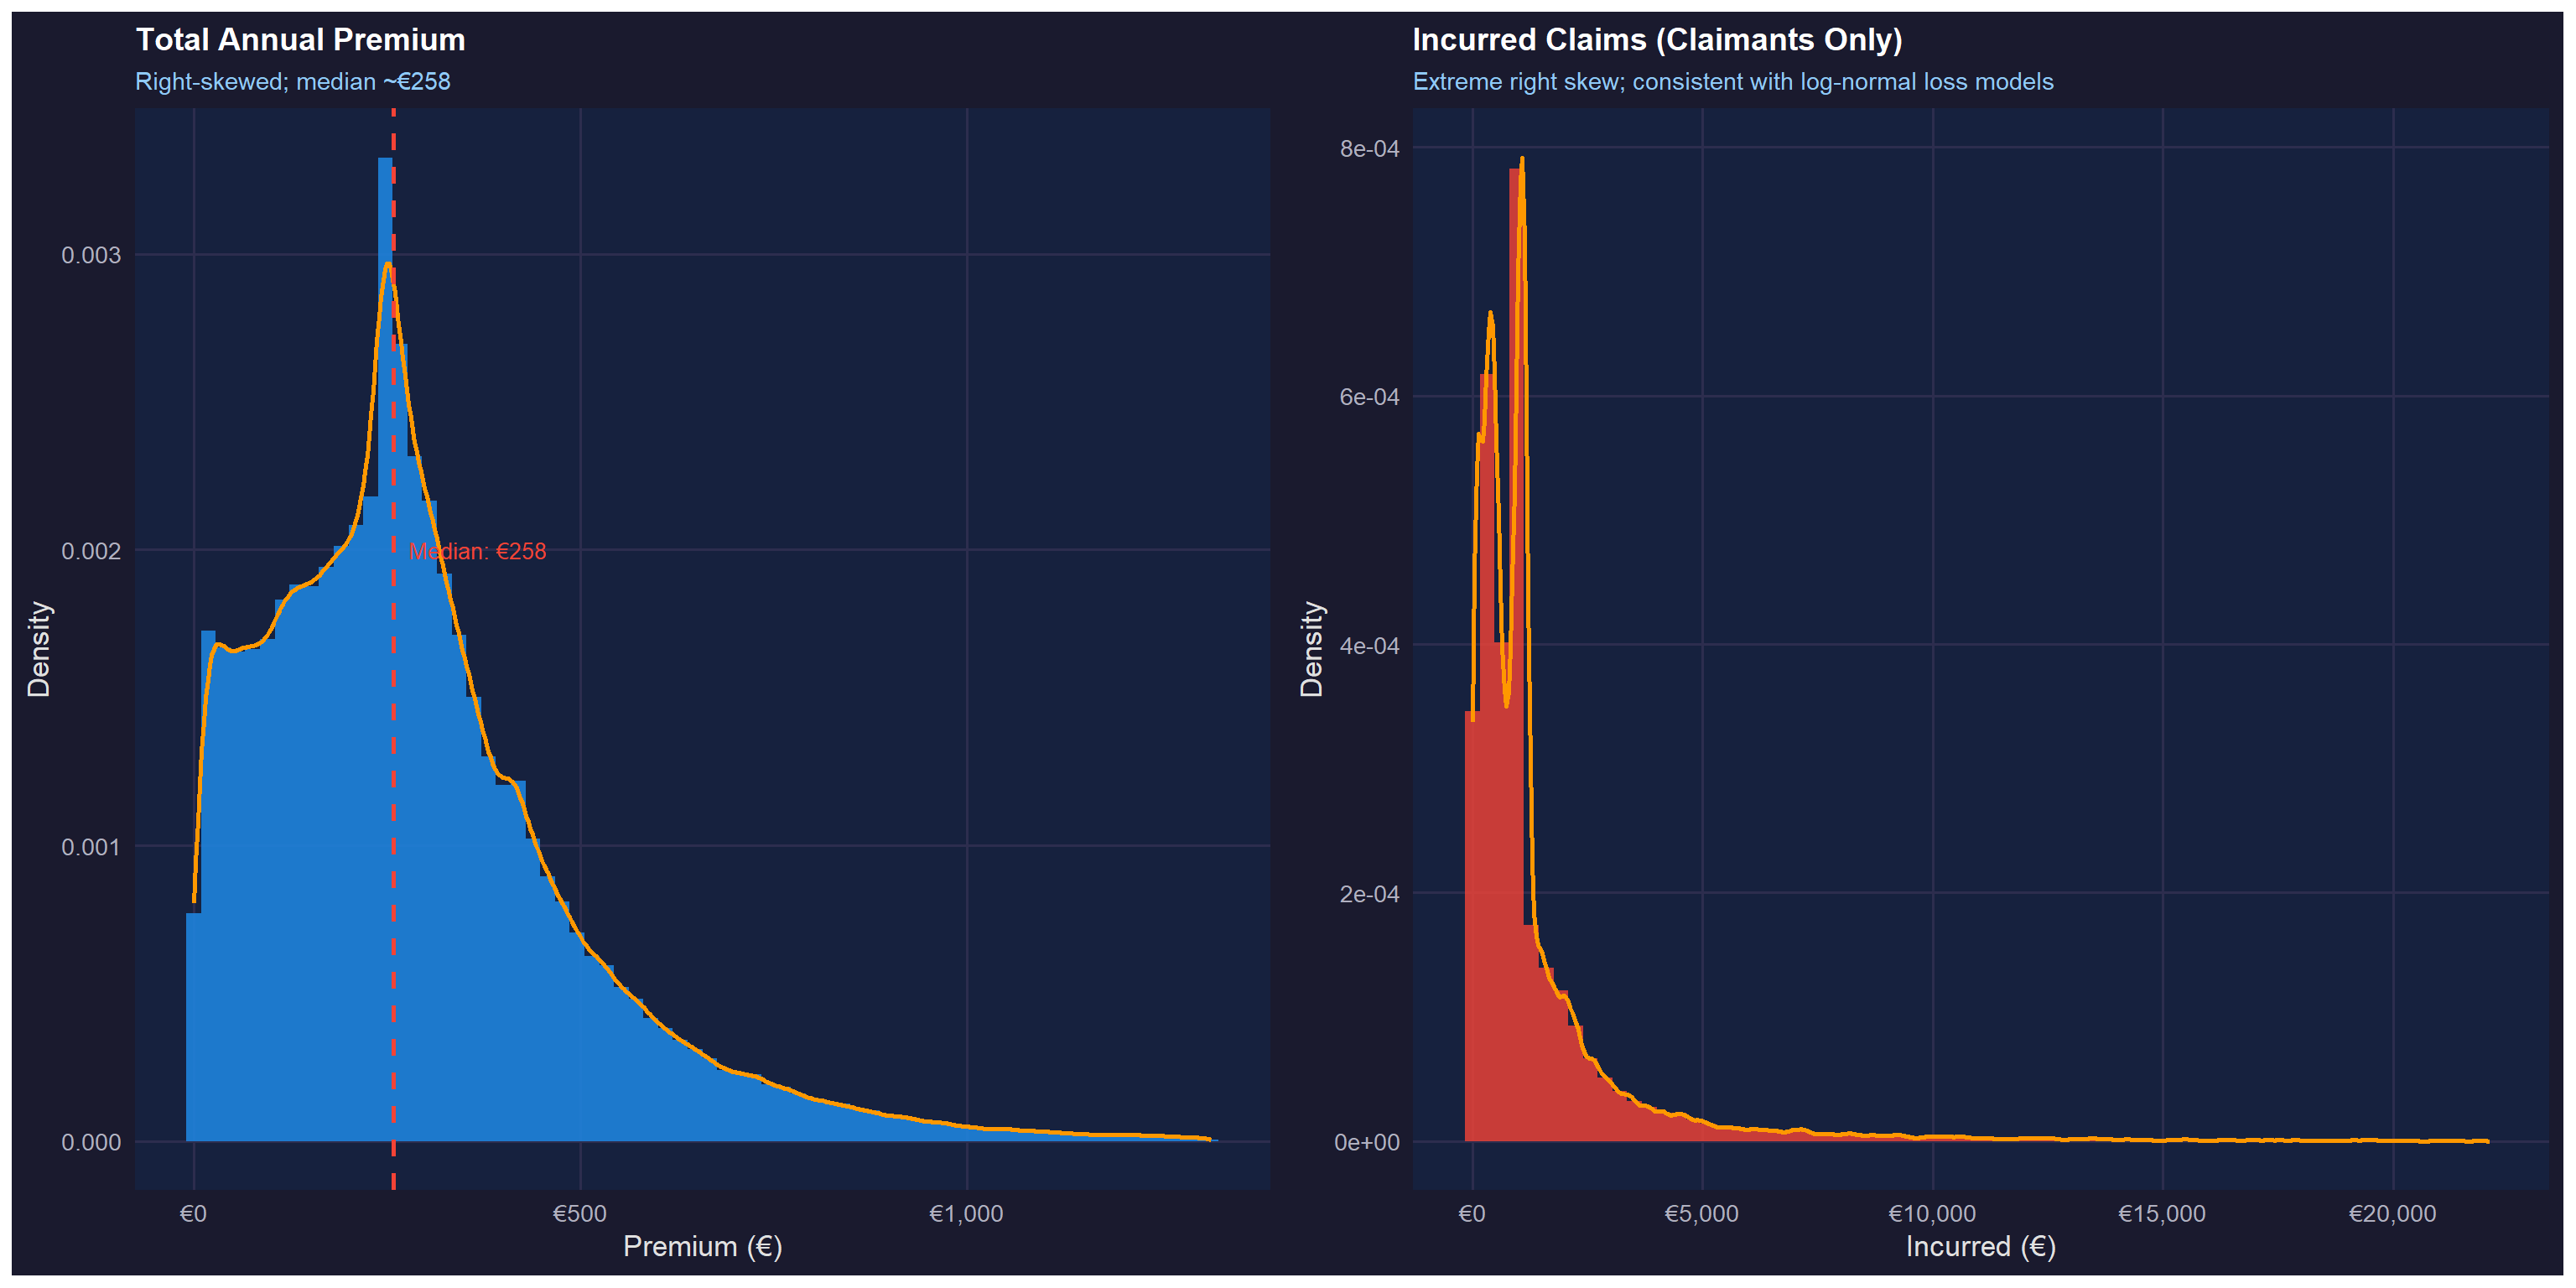
- Univariate: Premium & Claims — Distribution shape and skewness
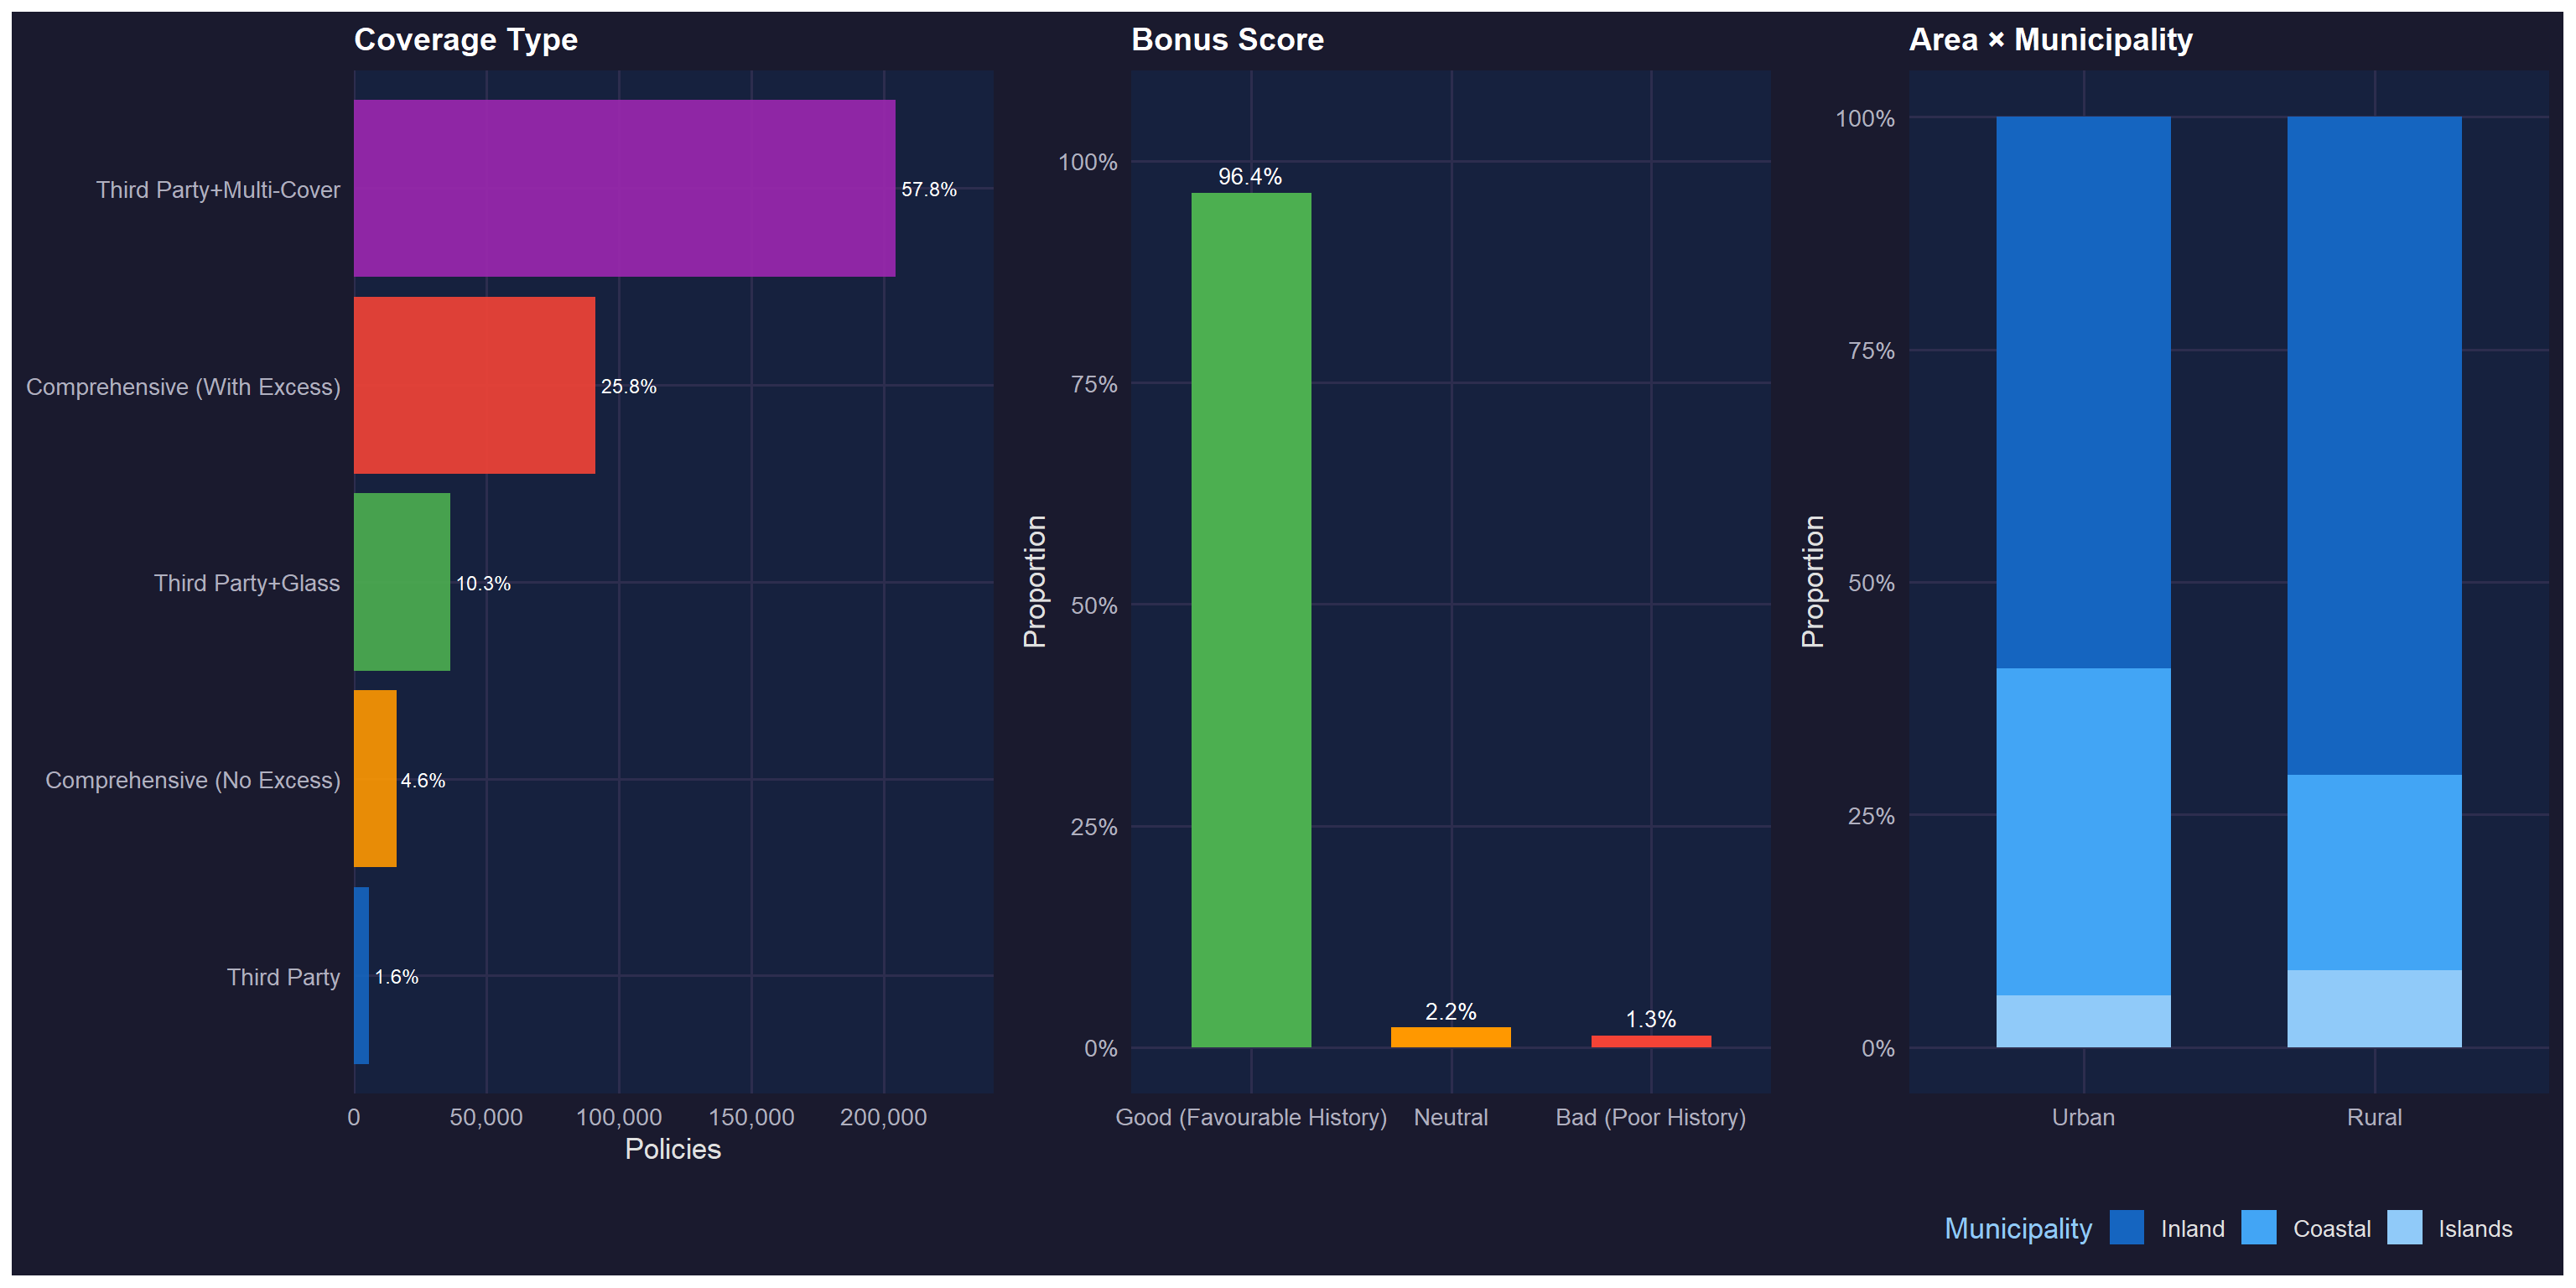
- Univariate: Categorical Variables — Coverage, bonus score and geography
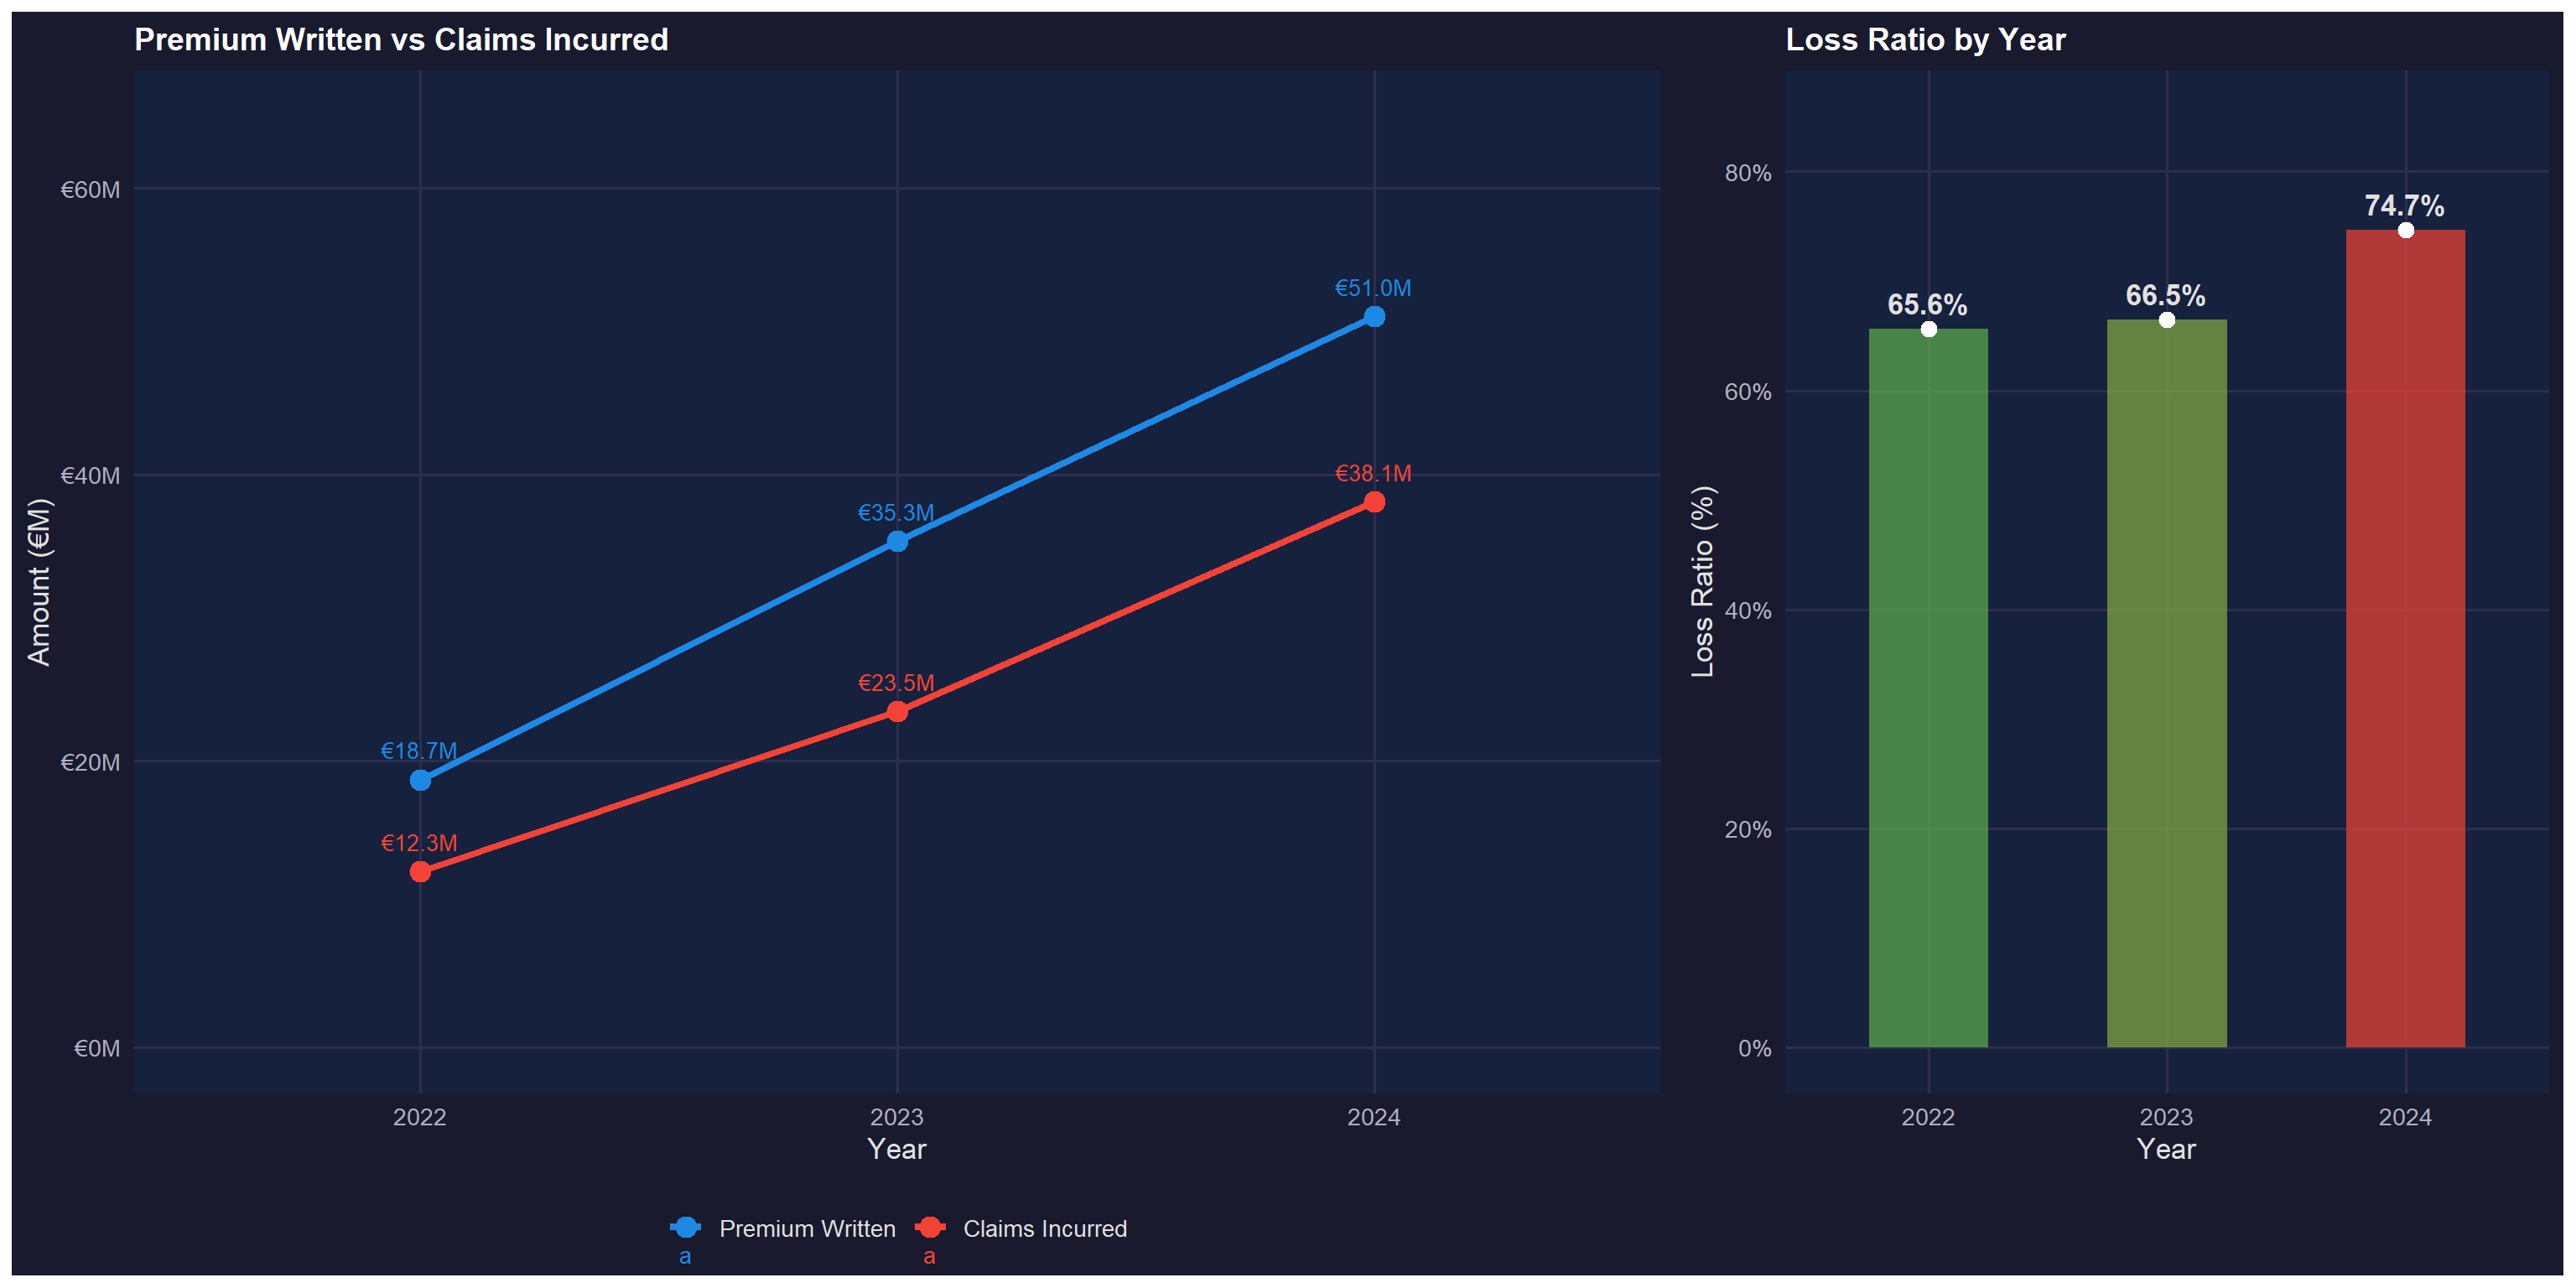
- Temporal Trends — Year-on-year premium, claims and loss ratio evolution
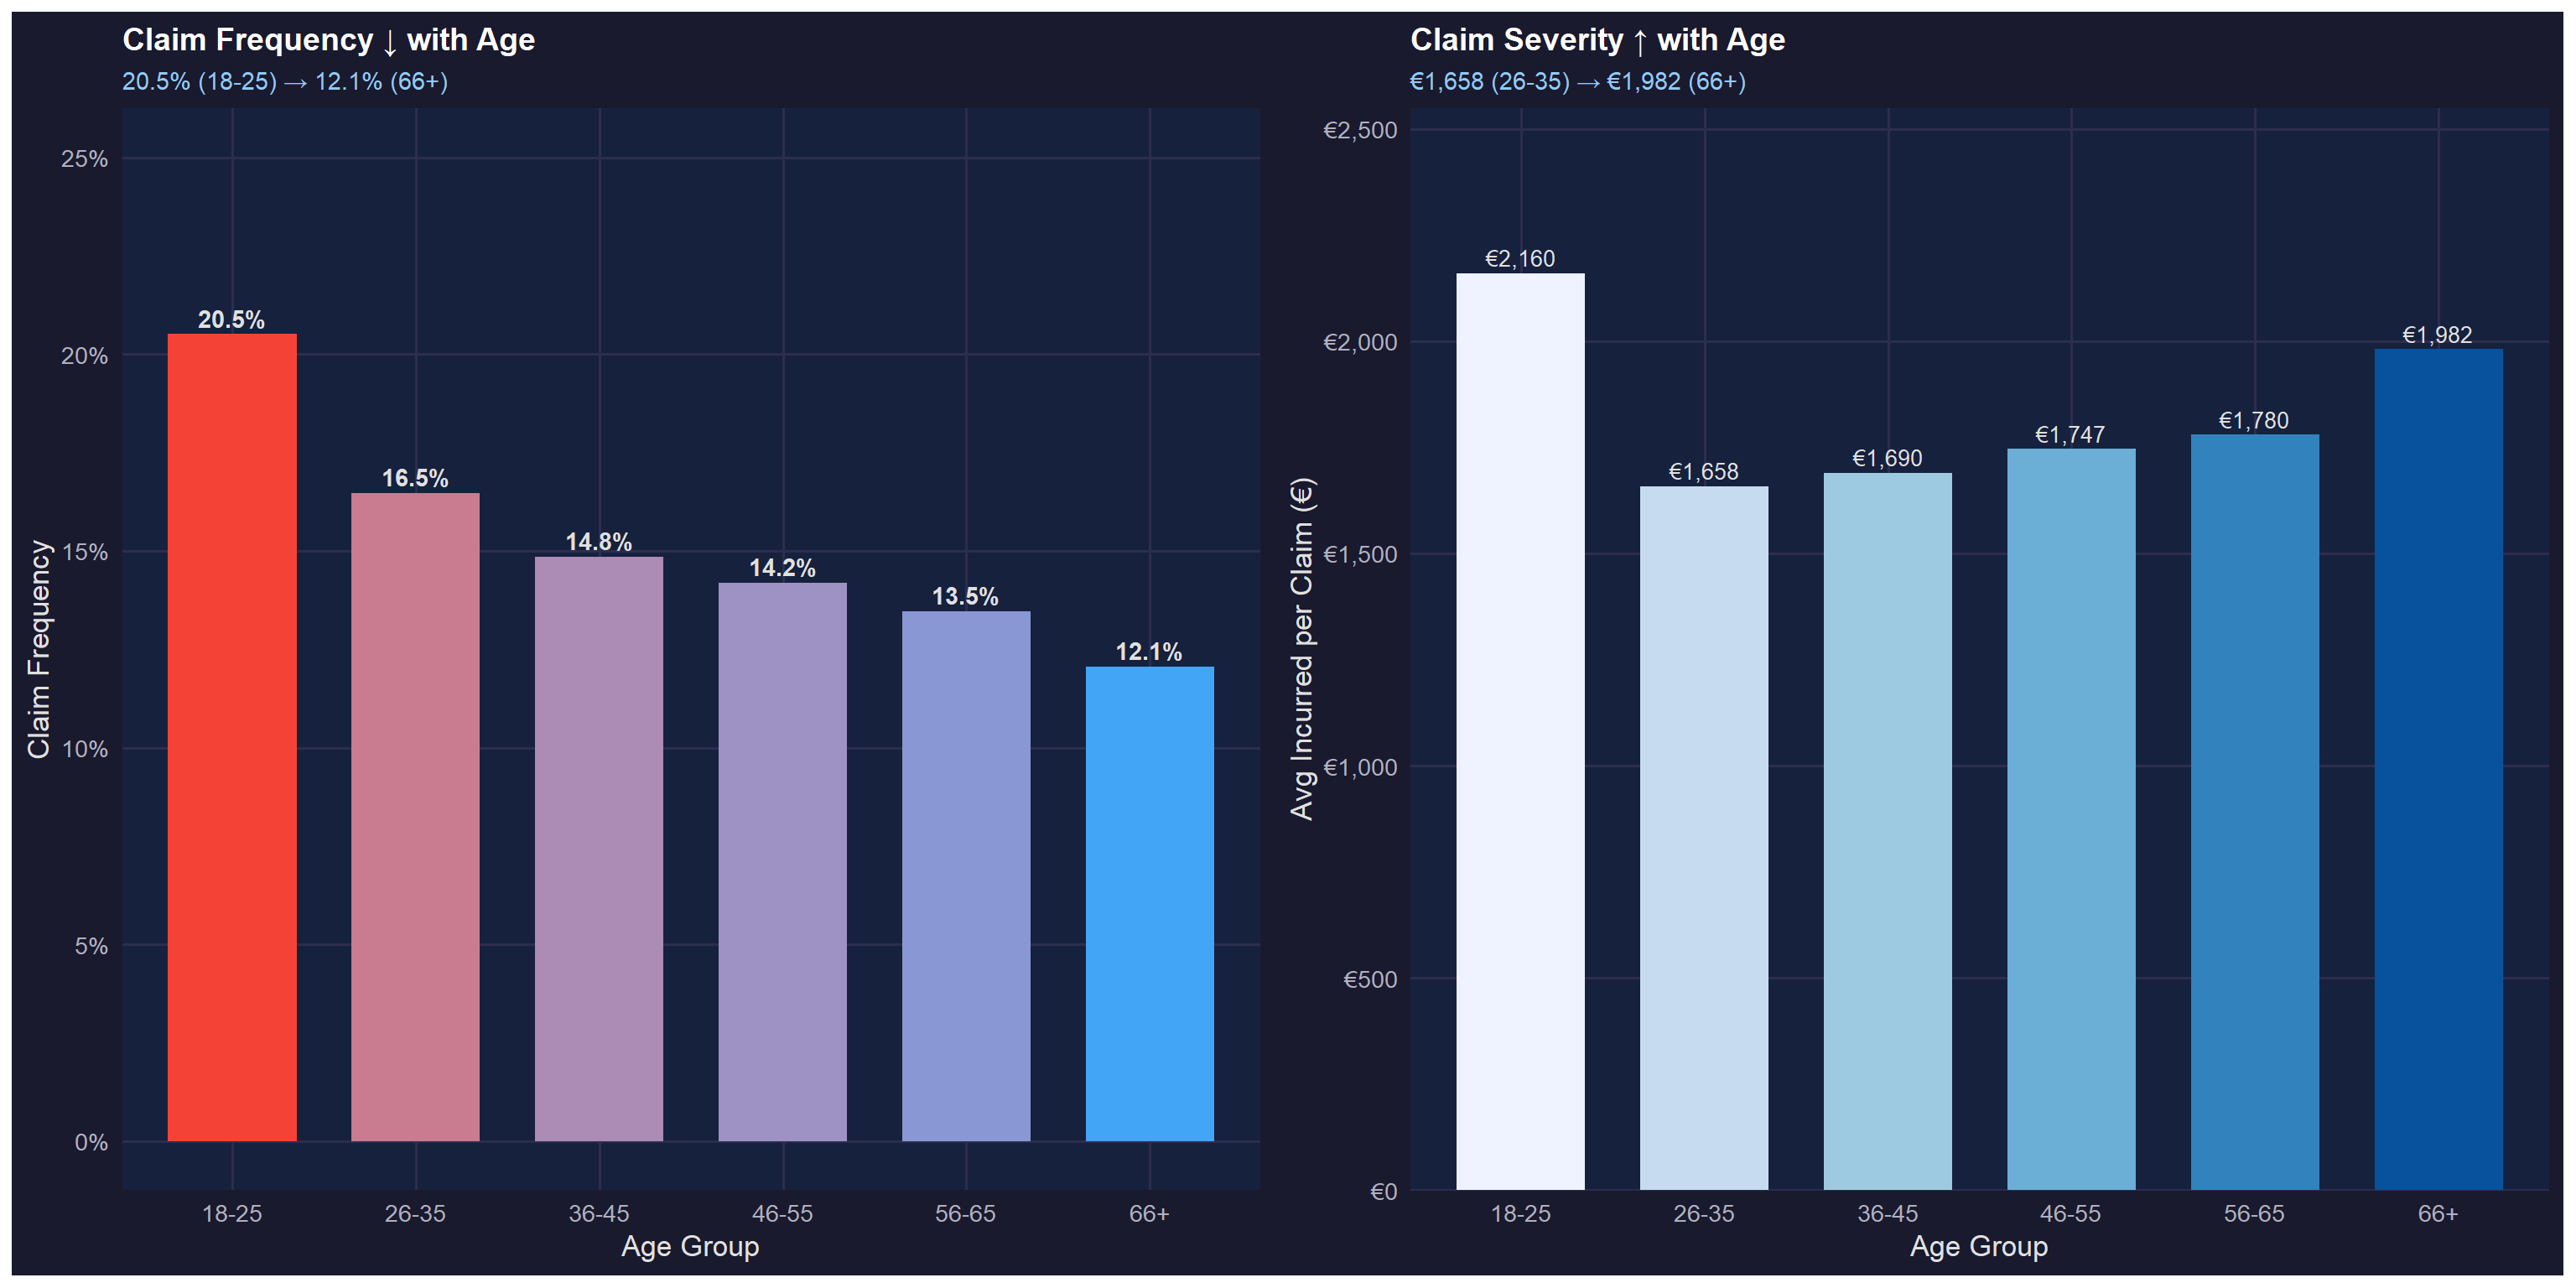
- Bivariate: Driver Age vs Risk — Frequency-severity trade-off
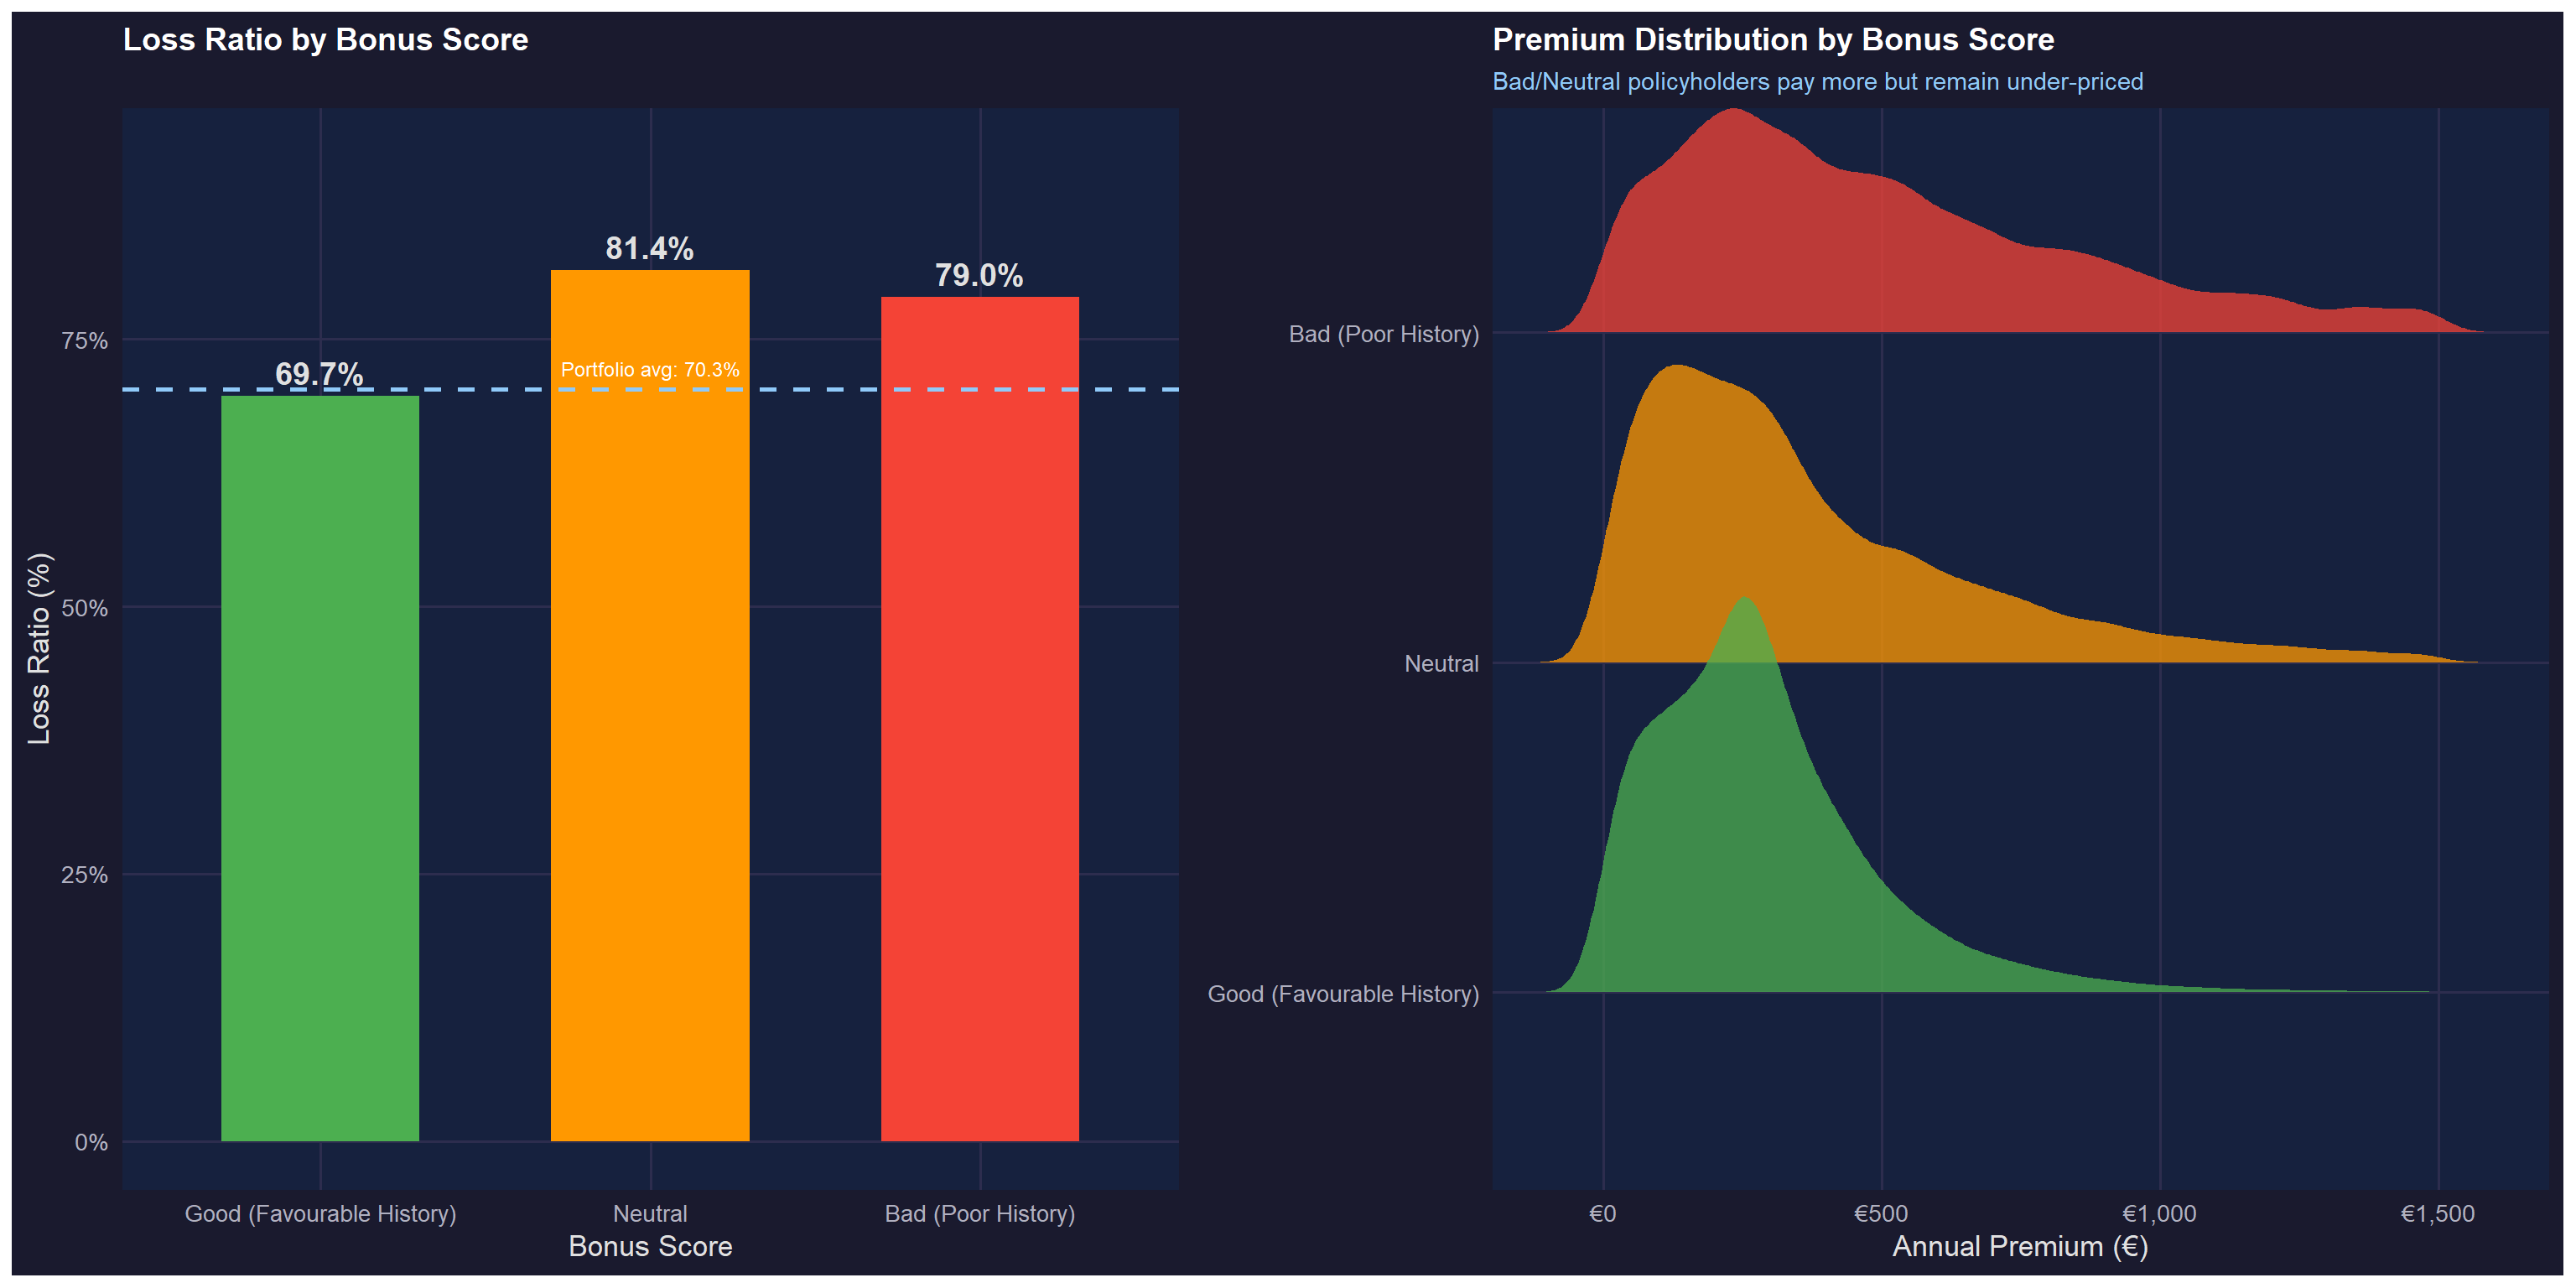
- Bivariate: Bonus Score vs Loss Ratio — Claims history as a risk discriminator
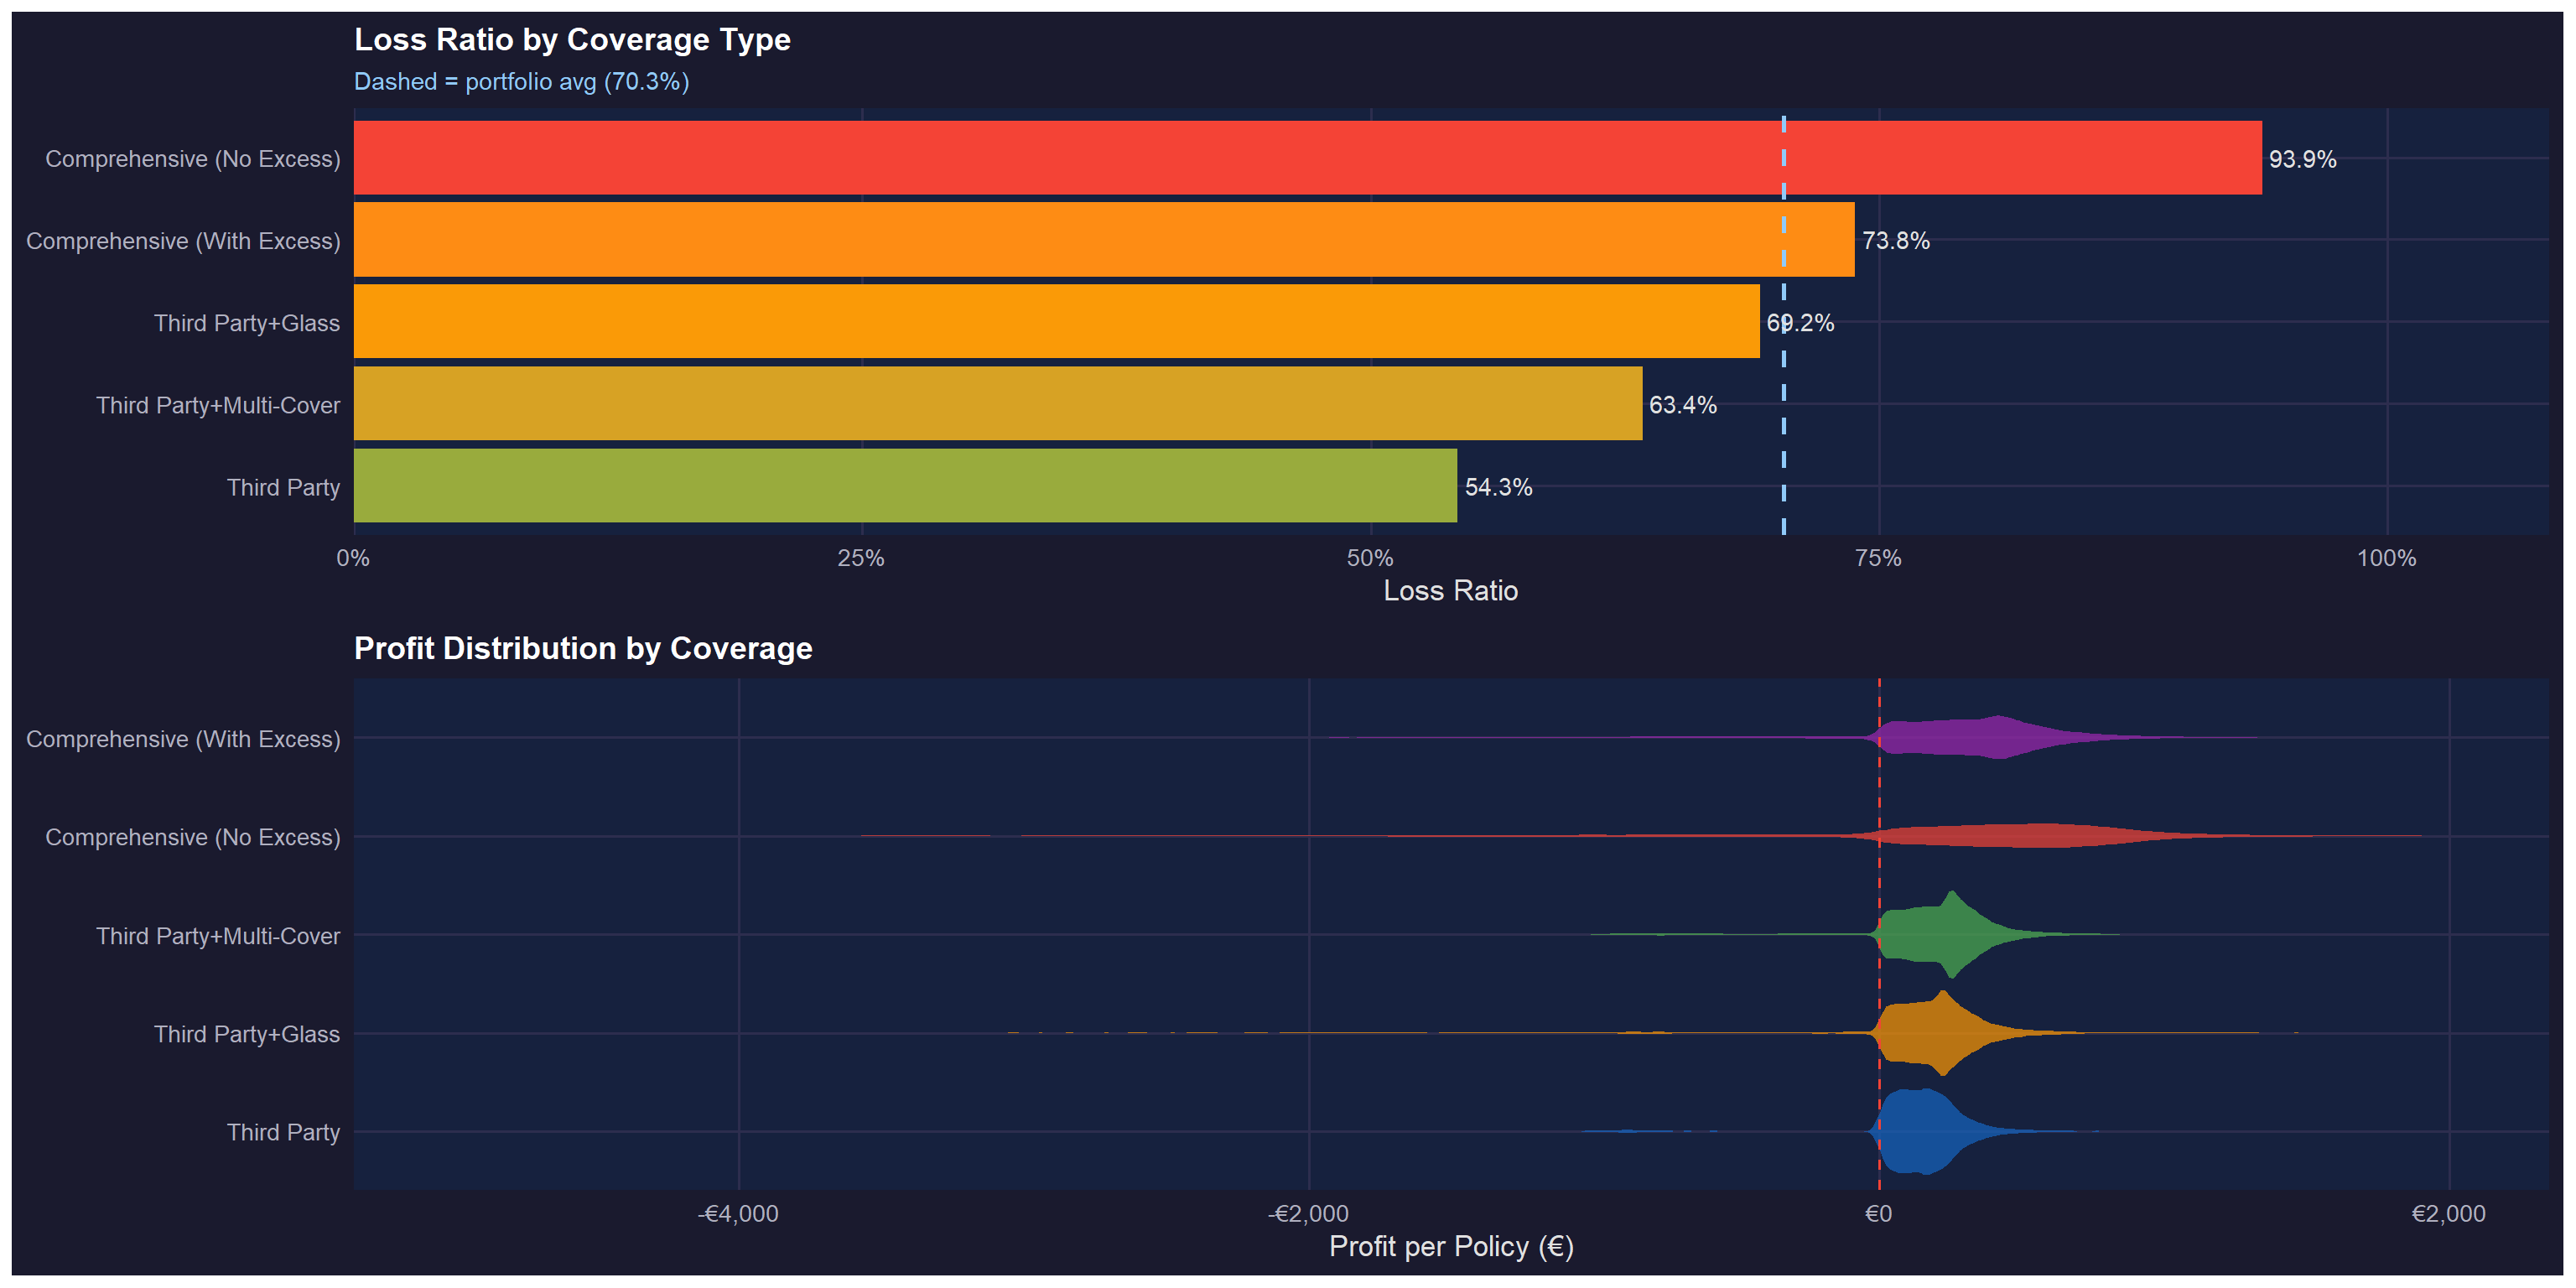
- Bivariate: Coverage Type vs Profitability — Product line analysis
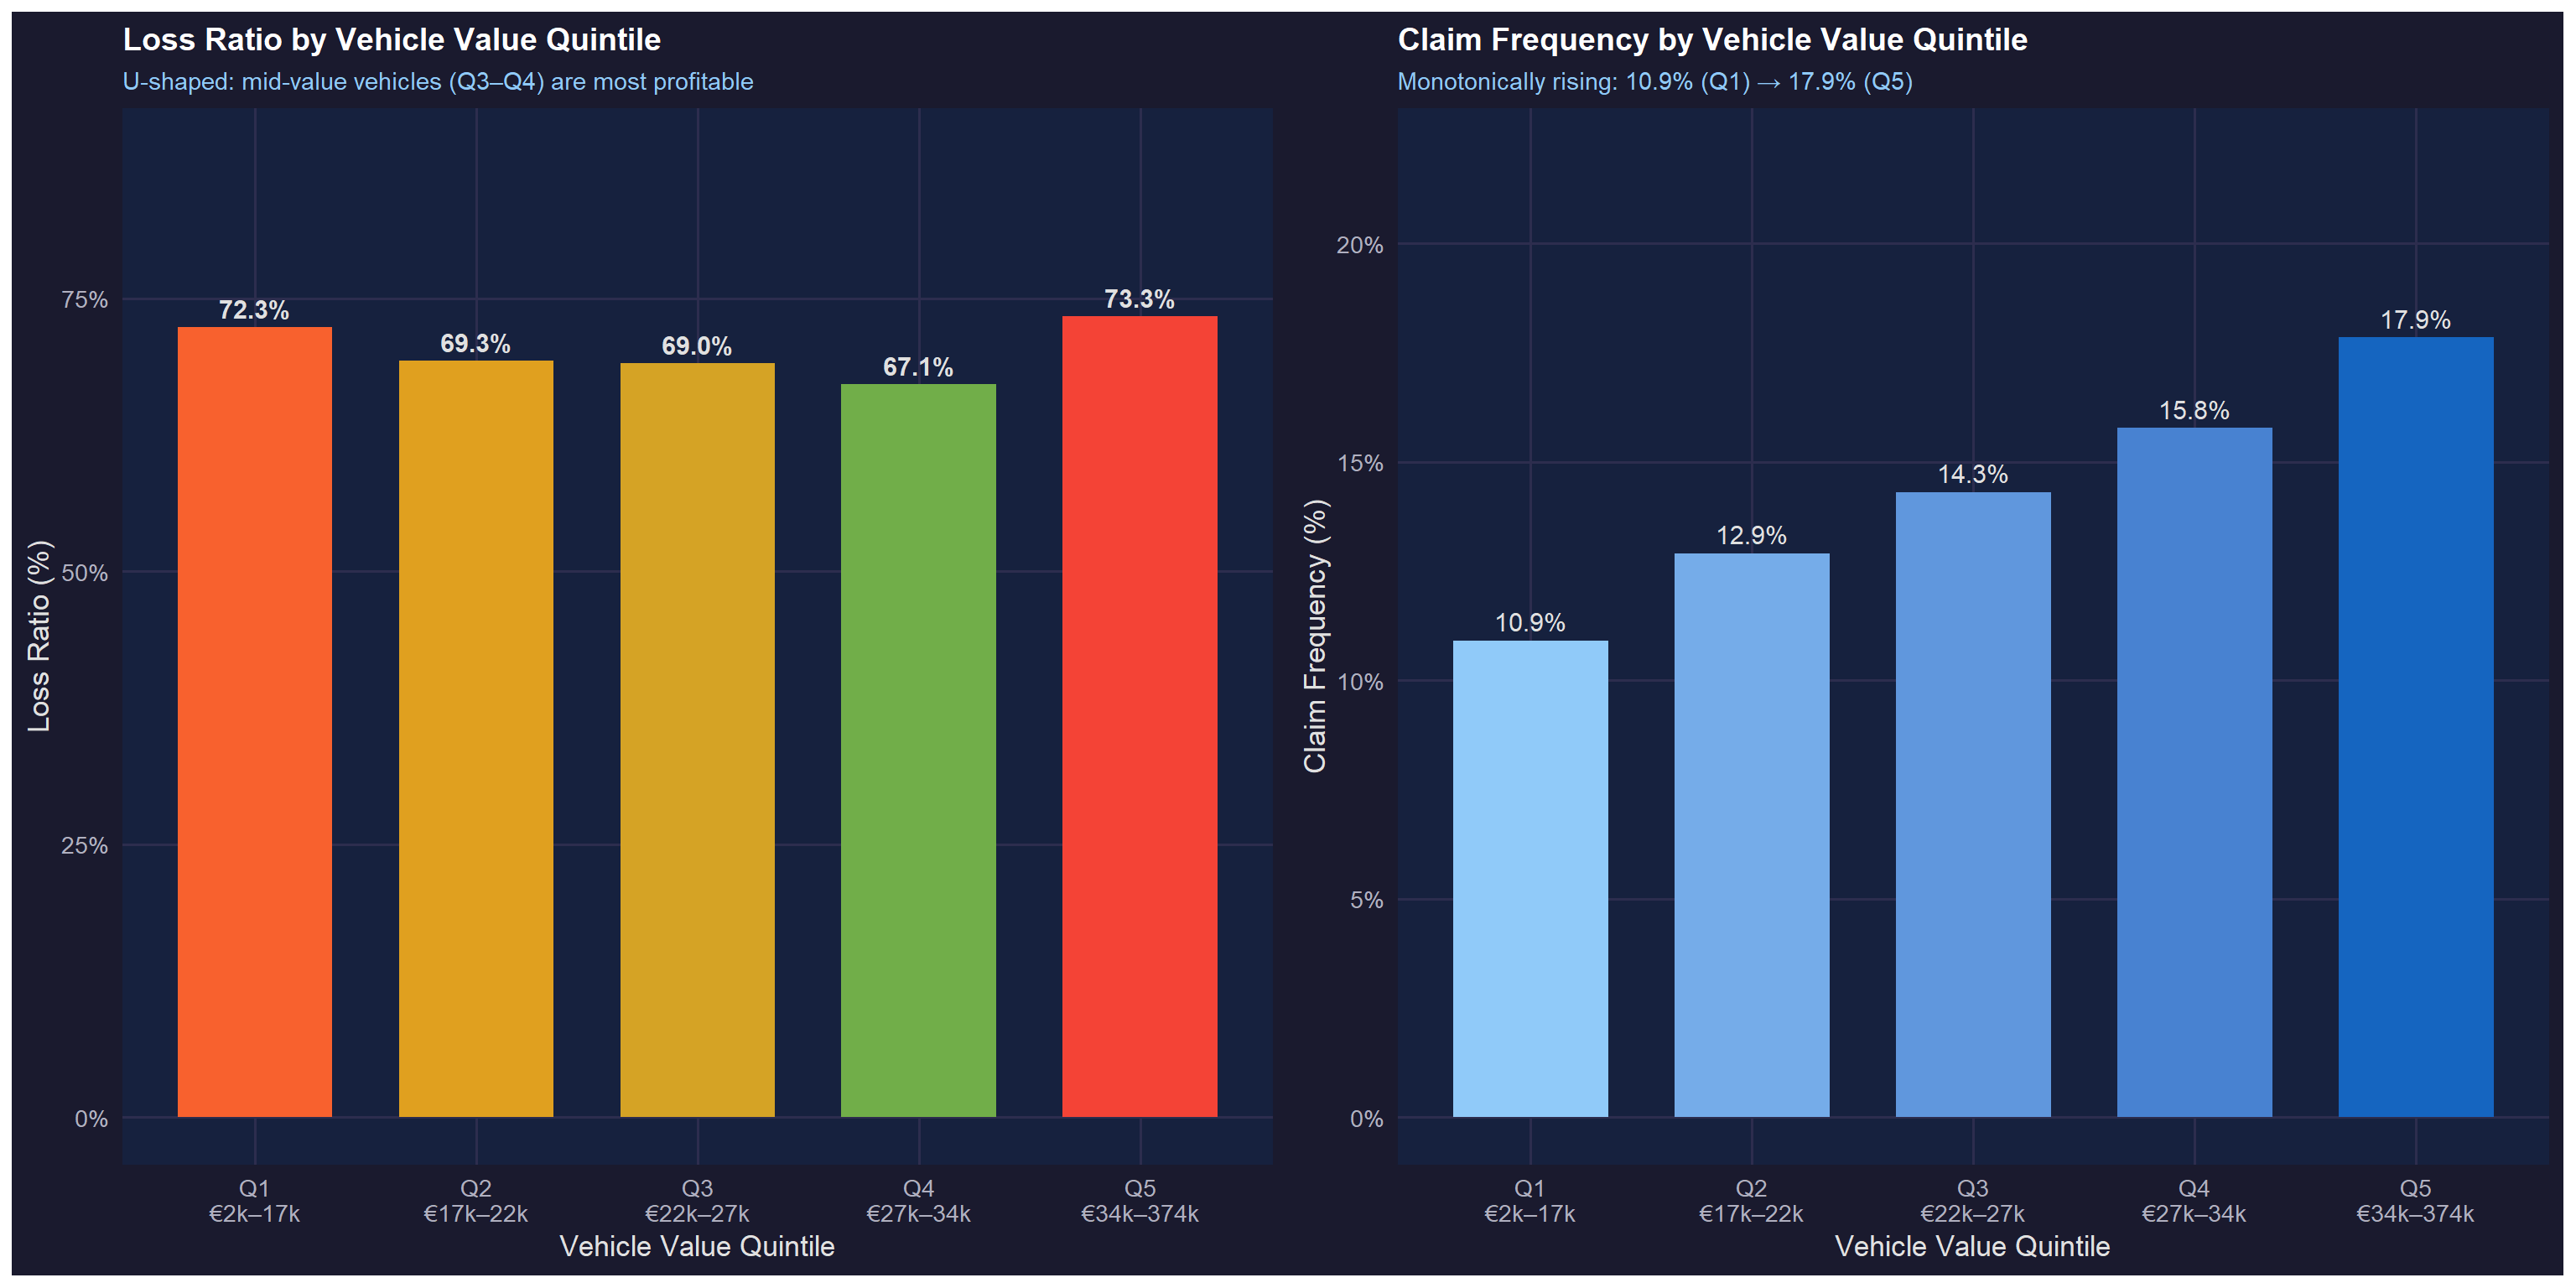
- Bivariate: Vehicle Value — U-shaped loss ratio and rising frequency
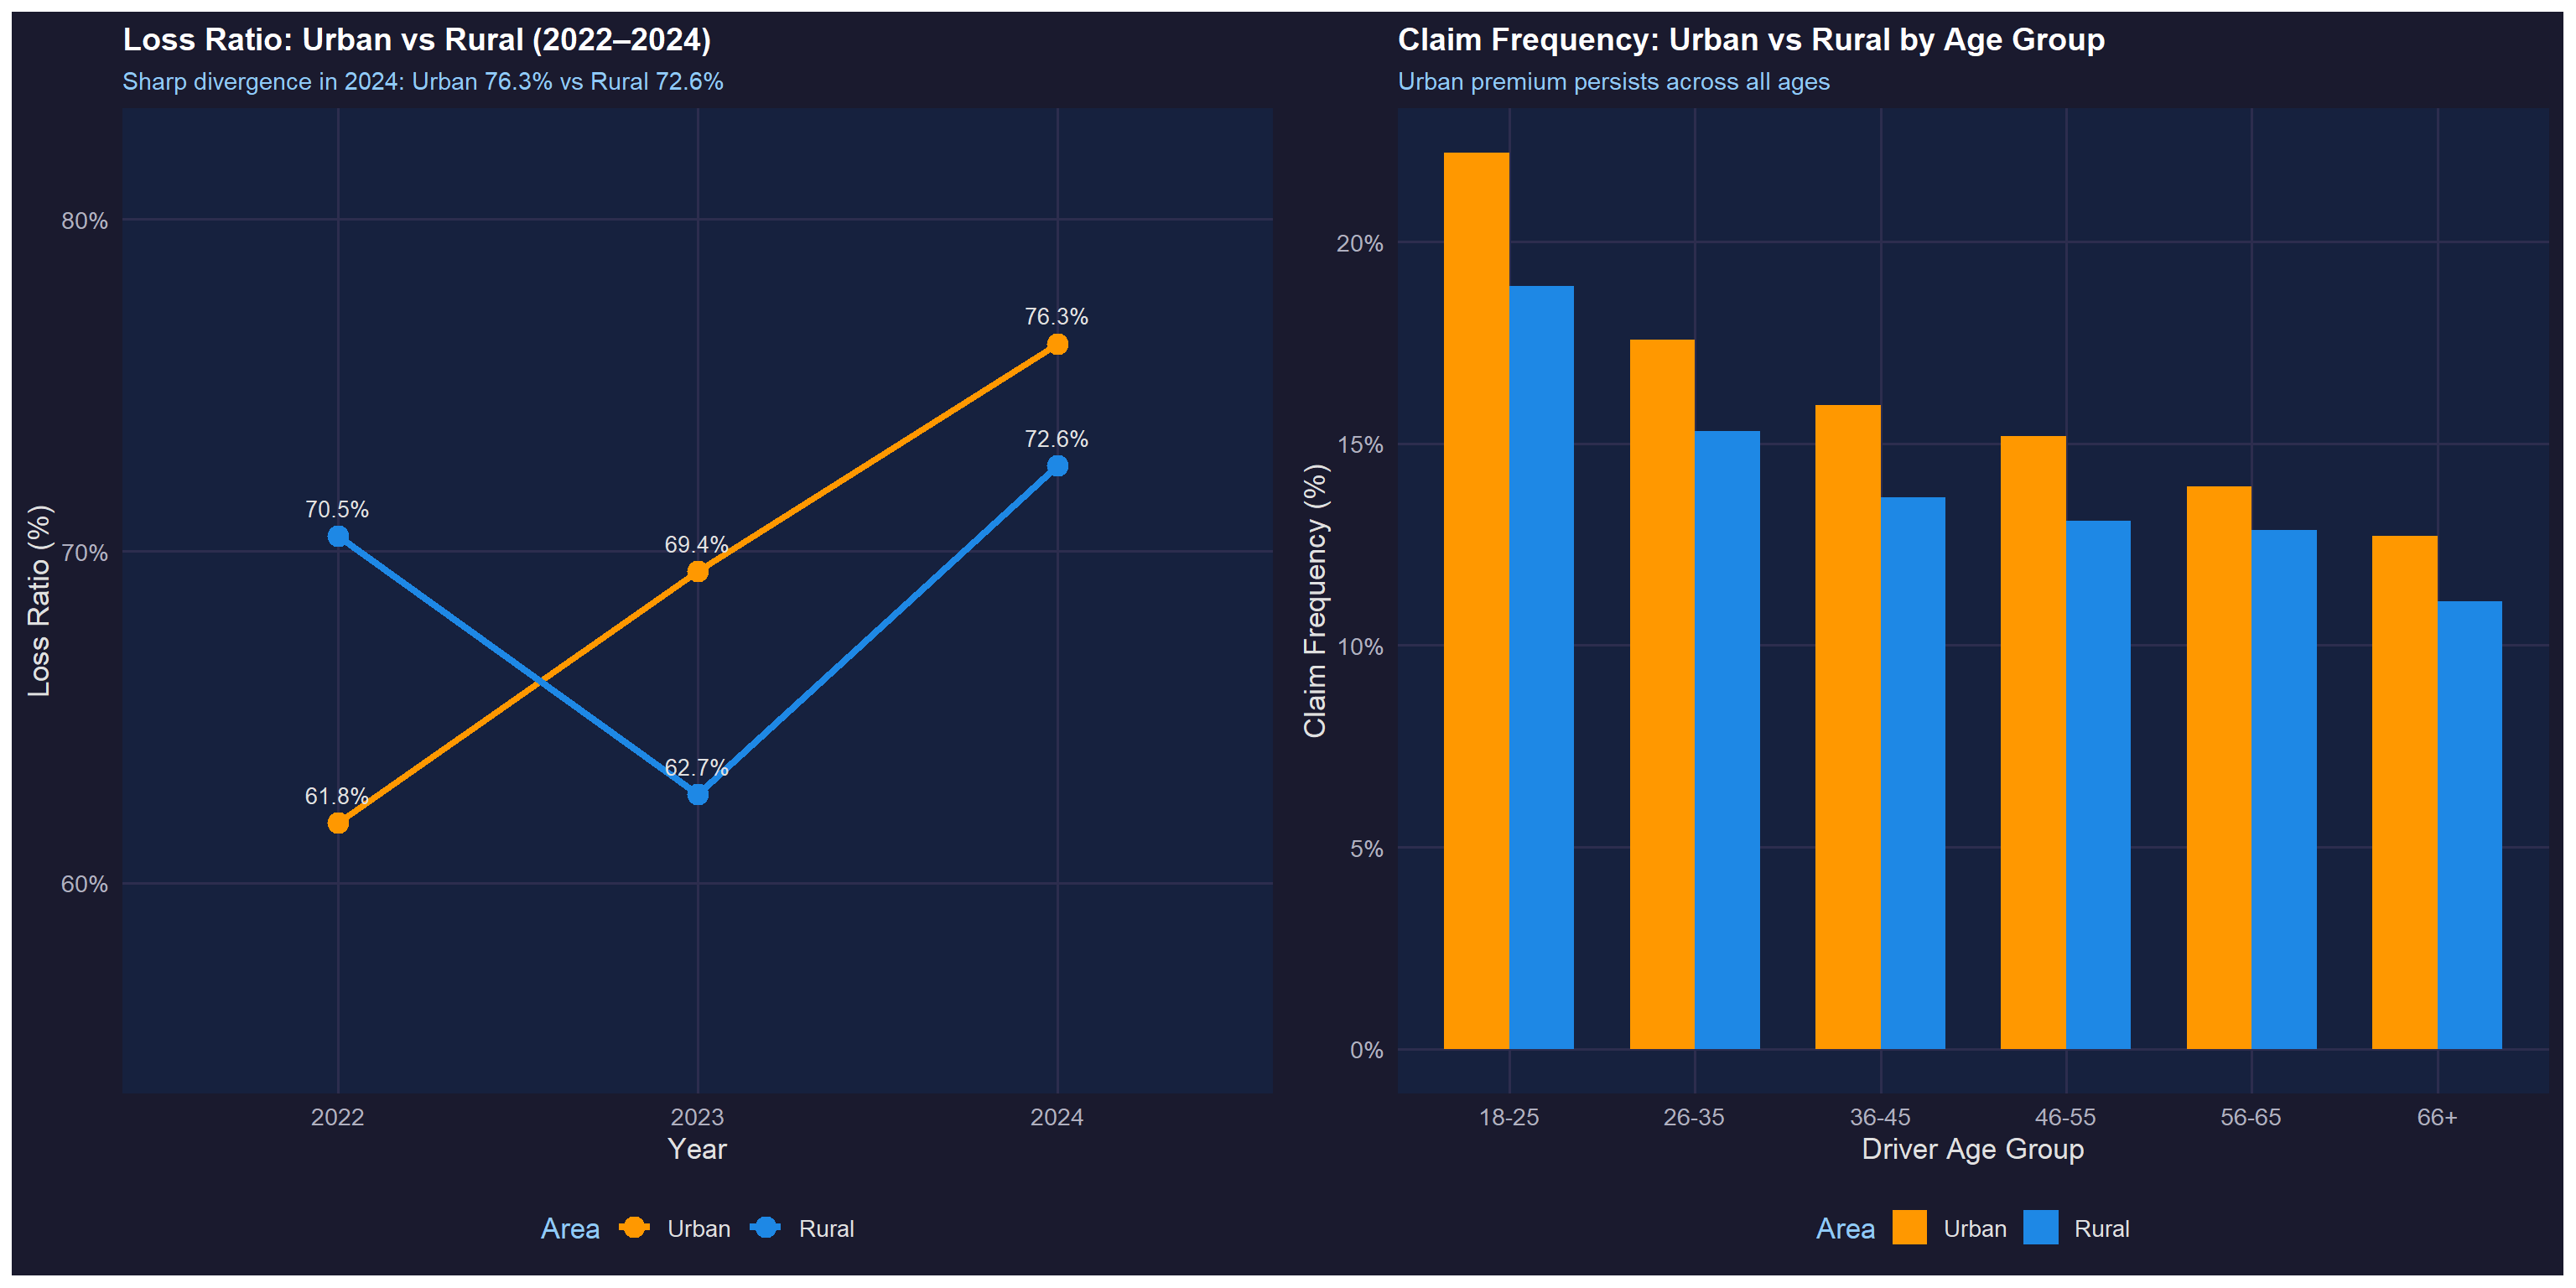
- Bivariate: Urban vs Rural — Geographic risk divergence
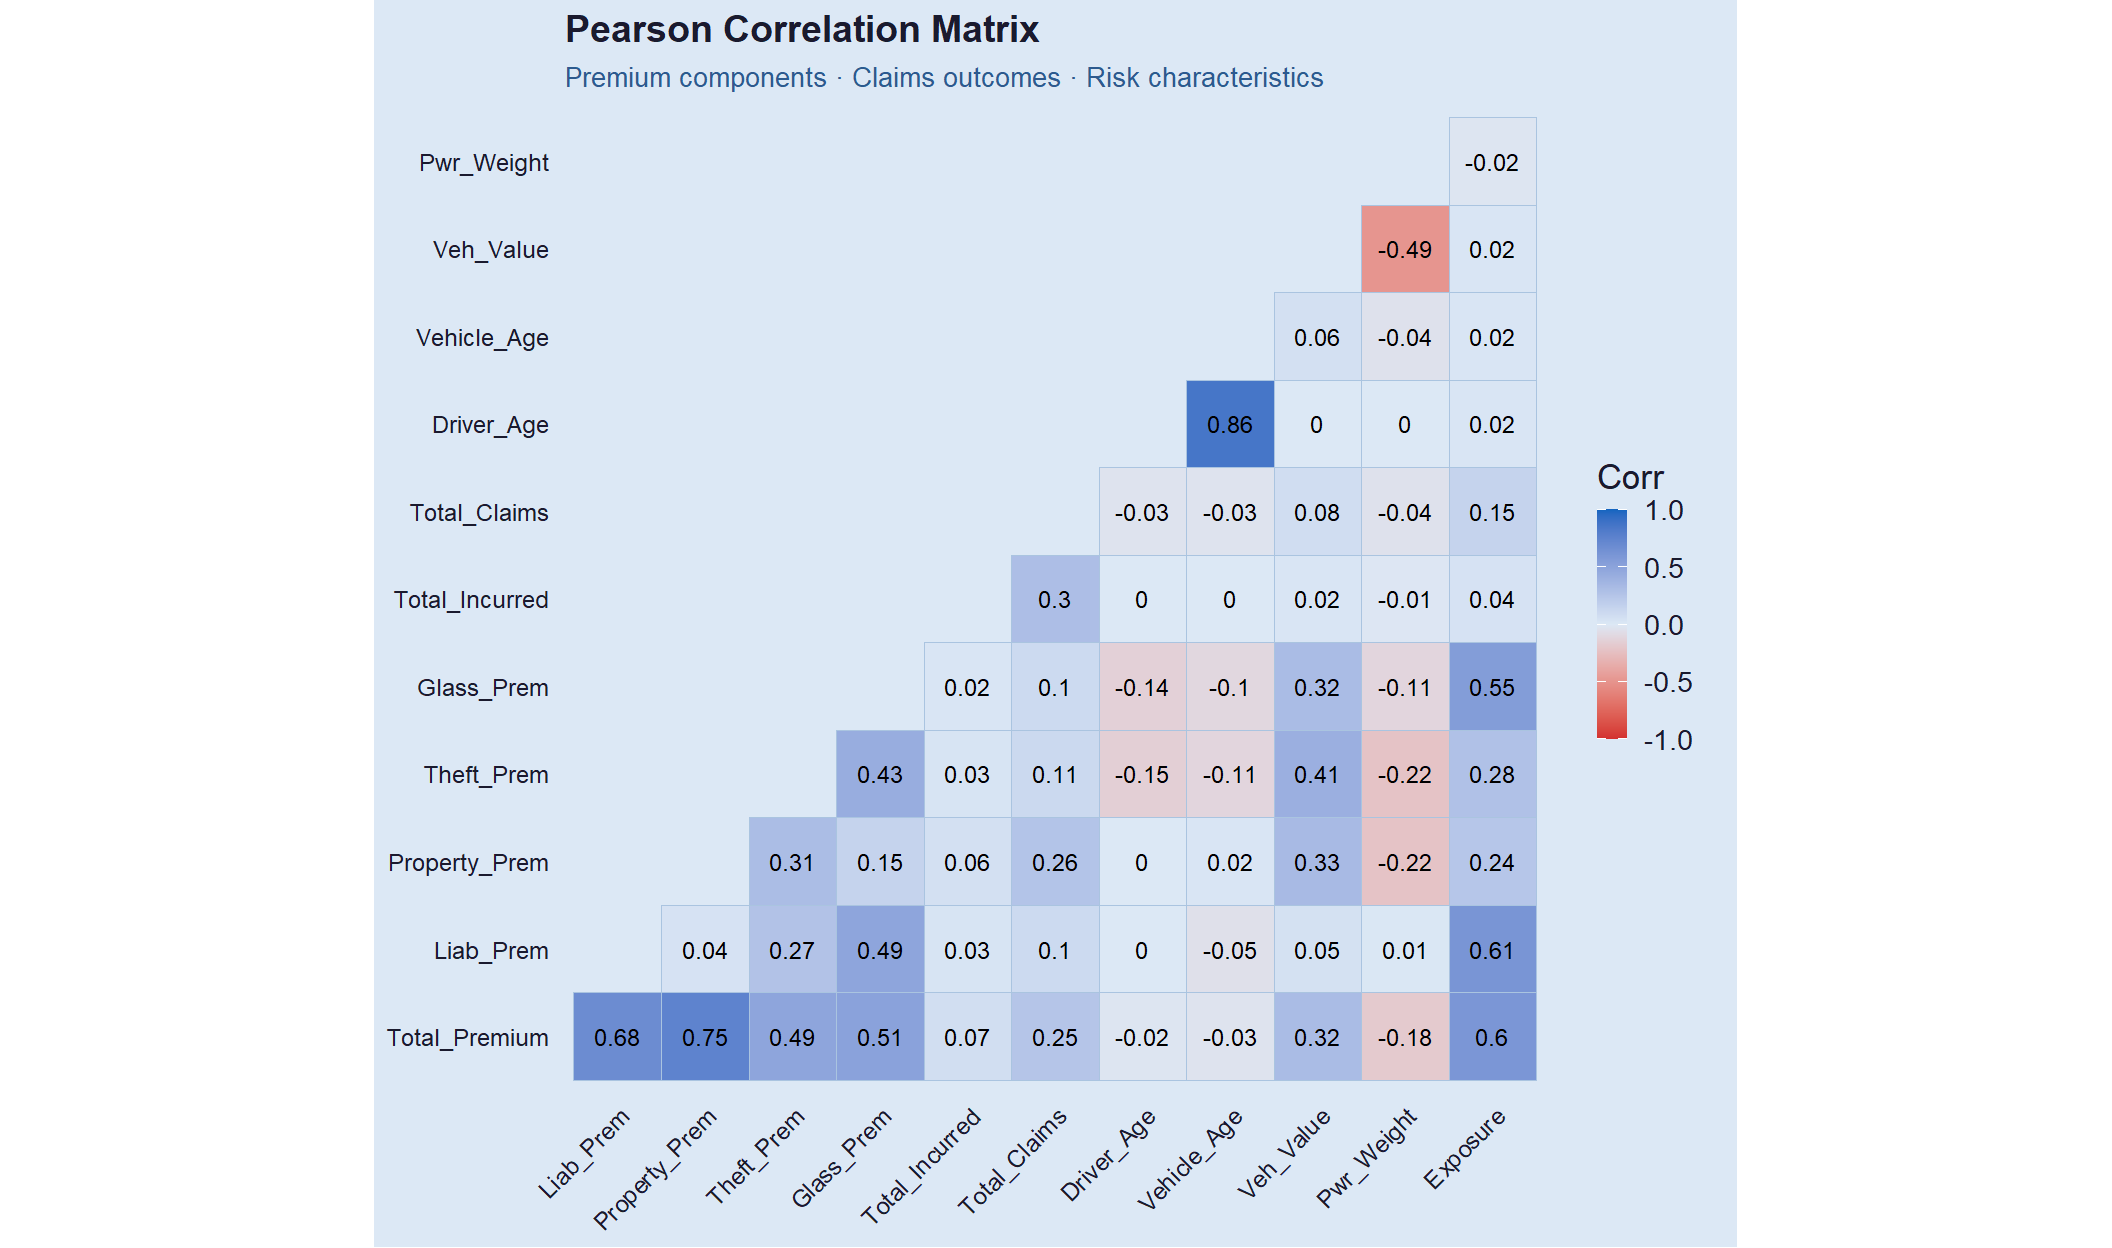
- Correlation Landscape — Premium structure and predictive power
- Key Insights & Recommendations